by Douglas L. Chenin, DDS
Obstructive Sleep Apnea (OSA) is a sleep related breathing disorder with a pathophysiology that is highly dependent on the form and function of the upper airway anatomy. The upper airway anatomy of patients can be visualized in 3D in great detail using Cone Beam Computed Tomography (CBCT). The ability for clinicians to analyze and comprehend the anatomy of their patients is of the utmost importance. New CBCT software technology updates in the Invivo5.4 software by Anatomage Inc have just been released which push the boundaries of what CBCT imaging can do for upper airway assessments. The new tools and features provide very comprehensive visualizations, measurements, and visual graphs. This article provides a brief description of the new tools and features and demonstrates some of their clinical applications.
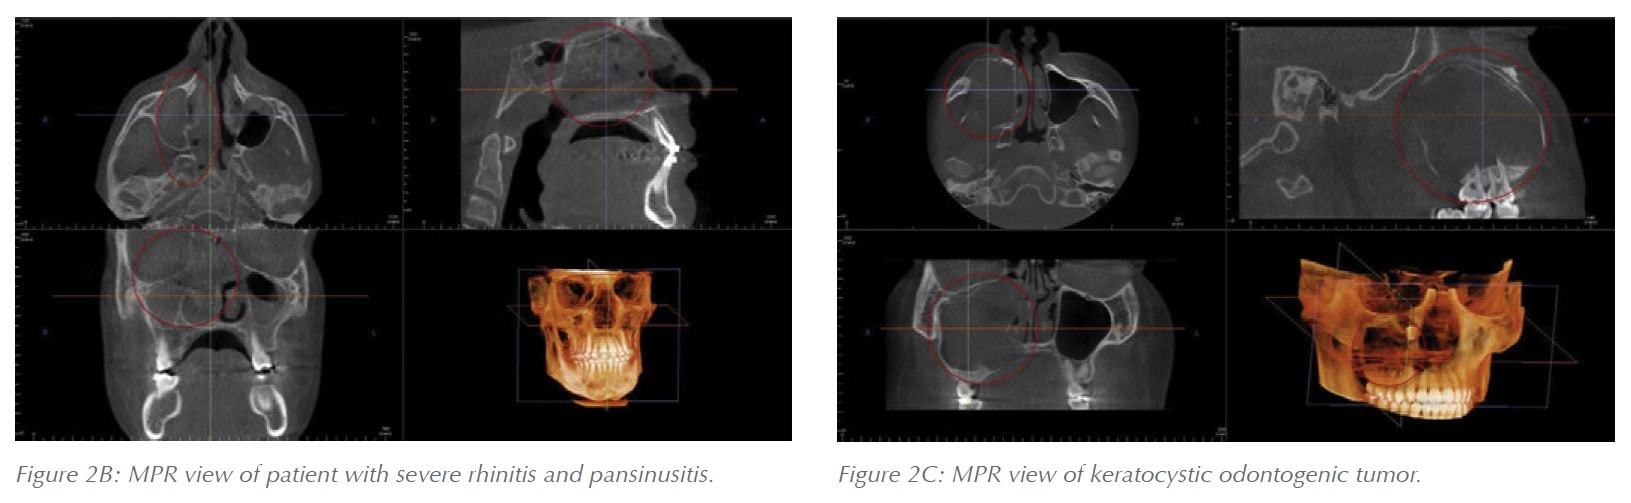
 All CBCT software packages minimally provide tools and capabilities to visualize the airway in cross-sectional views and to preform linear measurements. The typical setting is to use a Multi Planar Reformatted view (MPR) where the sagittal, axial, and coronal views can be visualized simultaneously in a grayscale colorization scheme (Figure 1). Despite their simplicity these views can be of tremendous value to quickly assess patients’ airways and adjacent anatomical structures. This technology enables clinicians to easily identify patients with swollen tonsils, large or long soft palates, airway constrictions, nasal and sinus disease, septum deviations, and more (Figure 2). These MPR visualizations provide clinicians with a better understanding of how patient anatomy contributes to OSA and may help with determining appropriate referrals and thus also aid in the decision making process for combination therapy.
 The next level up of advanced software tools involve airway tracing features that give the user the capability to delineate the airway’s boundaries, measure its volume, and calculate and locate the Minimum-Cross-Sectional Area (MCA) (Figure 3). Moreover, it is important to remember that although they are the more advanced and visually stunning assessments, the grayscale cross-sections previously mentioned still provide tremendous value in assessing the complete anatomical picture of the patient. The advanced segmentation tools essentially zoom in and focus solely on the airway apart from the rest of the anatomy and they provide very detailed information on the airway’s size, shape, and constrictions if any are present.

However, these detailed airway assessments still need to be used in combination with the standard cross-sectional visualizations of the entire CBCT scan in order to properly conceptualize the complete anatomical picture.
There are significant advantages to the airway tracing and modeling features mentioned above. For instance, they can create a 3D model of the airway that can be visualized in order to give the clinician a better understanding of the airway’s morphology and where problem sites are located (Figure 4). They make it very easy to visualize the anatomy that is directly impacting the airway and creating indentions in it which are typically caused by structures such as the soft palate, base of the tongue, and tonsils. Additionally, 3D models of the airway provide further measurement and even automatic detection capabilities. In the Invivo5.4 software, when the airway is segmented both the volume measurement of the airway and the Minimum Cross-Sectional Area (MCA) are automatically detected and calculated.
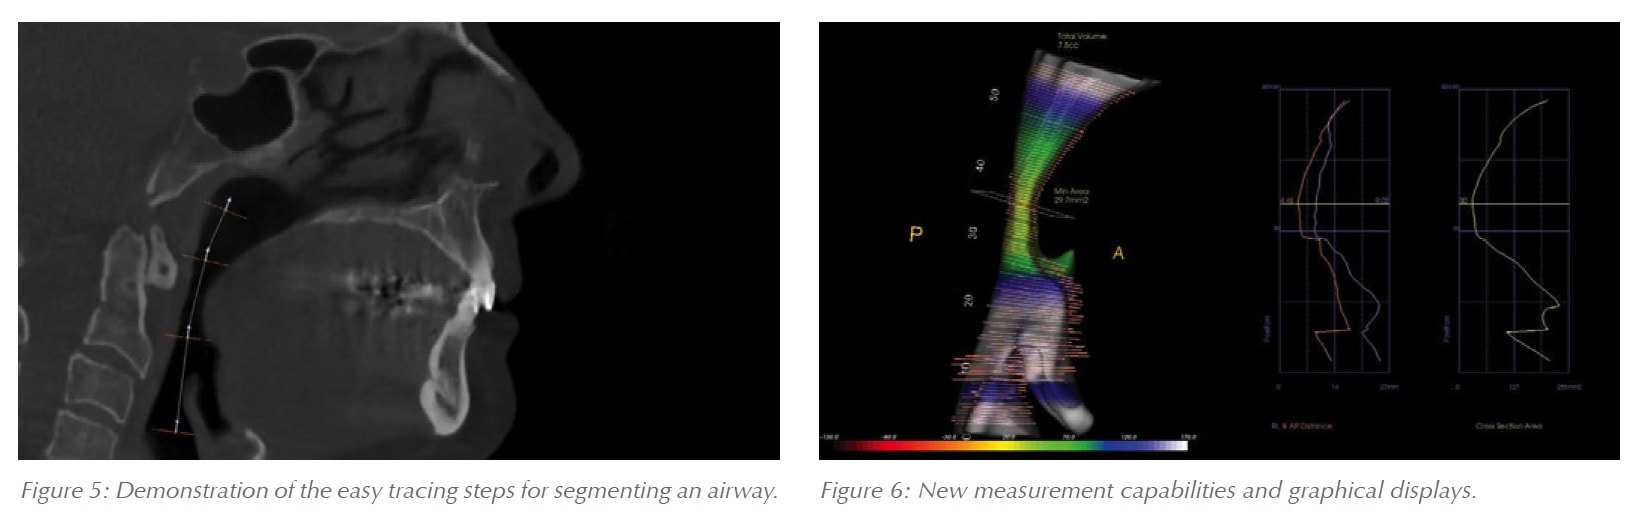
 The airway segmenting tool within Invivo5.4 functions by drawing a line down the middle of the airway in a sagittal grayscale view (Figure 5). After the line is drawn the software will automatically detect the airway space within the soft-tissue boundaries based on the Hounsfield Unit threshold of air. Once the airway lumen has been defined and the boundaries are well established the volume of the airway and the Minimum Cross-Sectional Area (MCA) are automatically generated. Amazingly, the entire process only takes a few seconds.
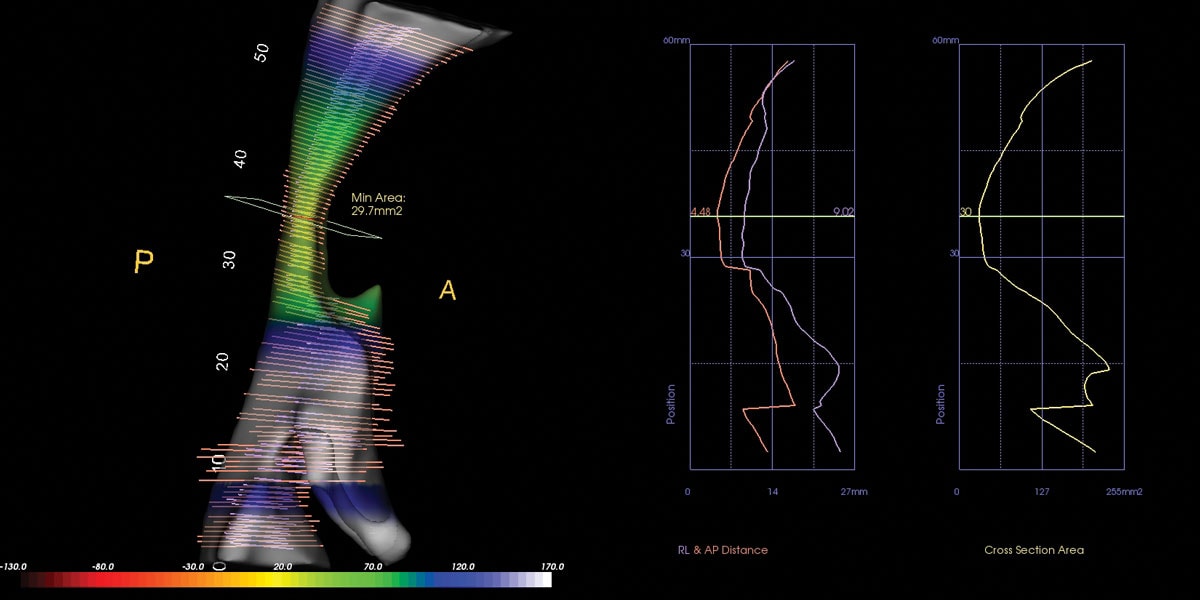
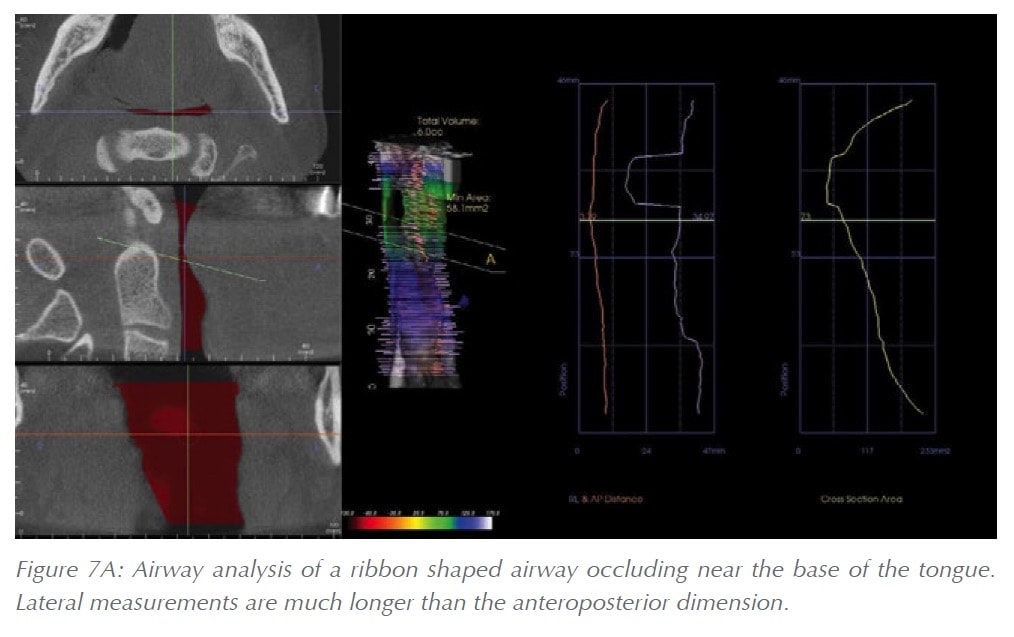
 The new tools of the Invivo5.4 software go even a few steps further and provide several new automatic measurements and new graphical data representations as well. In addition to the volume and area measurements mentioned above the new 5.4 update also provides lateral and anteroposterior measurements of the airway. These measurements along with the MCA, are provided as increments along the entire length of the airway. The measurements are mapped out in a visual graph as well (Figure 6). By comparing the lateral and AP dimensions the clinician may obtain an appreciation for the general shape of the airway. For example, when the lateral dimension of the airway is significantly greater than the anteroposterior dimension the airway is more ribbon shaped (Figure 7A). In the presence of swollen tonsils, the anteroposterior dimension can become greater than the lateral dimension (Figure 7B). When the lateral and anteroposterior dimensions are roughly equal the airway will be appear square shaped.
Beyond the above mentioned applications, these new measurements also provide a new way of conceptualizing the airway by the means of quantifying the shape of the airway. The axial cross-sectional shape of the airway at any given vertical level can be expressed as a ratio of the lateral measurement over the anteroposterior measurement. With this equation, a patient with swollen palatine tonsils would stand out as having a ratio value less than <1 around the vertical level near the base of the tongue. While a patient with a ribbon shaped airway would have a ratio value of 3-4. If a value that is several times greater than 1 is present near the nasopharynx it could indicate swollen adenoids. If that same value is present at the oropharynx level its most likely caused by the soft palate, the base of the tongue, or both. Thus, this ratio and its location could be used in the future to expand the automatic detection and airway assessment capabilities of CBCT software even further. The new tools just released are a step in this direction and pave the way for airway shape quantification in future updates.
The Invivo5.4 software updates have pushed the boundaries of what CBCT technology can do for upper airway imaging and these boundaries will continue to expand as future updates are released. The new visualizations, measurement capabilities, and visual graphs not only provide great diagnostic tools, but also excellent patient education and presentation materials. The new updates and tools also provide new research potentials to explore and it will be exciting to witness the research that is produced with them and the correlations that are discovered.
Stay Relevant With Dental Sleep Practice
Join our email list for CE courses and webinars, articles and more..